
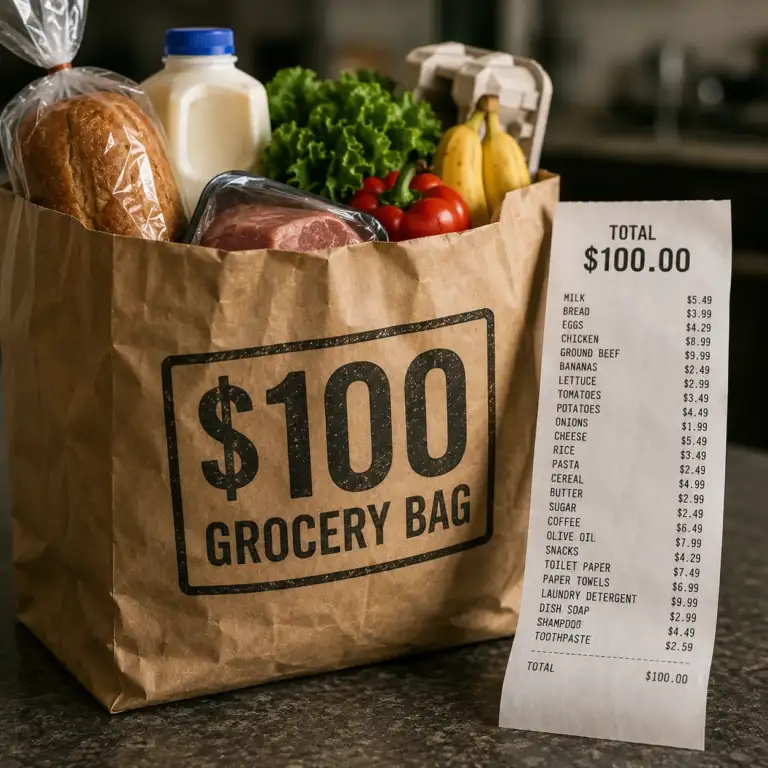
The White House points to a cooling inflation rate and calls it “big progress on prices.” A mother filling a cart at the grocery store looks at a receipt nearly $30 higher than it would have been five years ago and calls it something else entirely. Both of them are looking at real numbers. They are simply not looking at the same number, and understanding why is the key to understanding one of the strangest disconnects in American economic life today.
Something genuinely puzzling has settled into American economic life over the past two years. Official inflation has cooled substantially from its 2022 peak, unemployment remains historically low, and by nearly every traditional macroeconomic measure, the country is not in a downturn. And yet consumer sentiment has remained stubbornly, persistently depressed, running well below its pre-pandemic average even as economists insist the underlying data looks healthy. Commentators have taken to calling this gap the “vibecession,” often with a faint implication that the public simply isn’t reading the numbers correctly. This magazine believes that framing gets the story backward. The public is reading a different, and in some ways more honest, set of numbers than the ones showing up in the headlines, and the specific categories of spending driving that gap, groceries, insurance, utilities, housing, and childcare, tell a genuinely coherent story about why a “cooling” inflation rate can still feel like an anvil sitting on a household budget.
A Government Report and a Grocery Receipt Telling Different Stories
Headline inflation, as measured by the Consumer Price Index, is now running close to 3 percent annually, down sharply from the 9.1 percent peak recorded in June 2022. That is a genuine, meaningful improvement, and this magazine does not dispute the underlying arithmetic. But the CPI measures something specific and, for most households, somewhat abstract: the rate at which prices are currently changing, month over month or year over year. It does not measure, and was never designed to measure, how a family actually experiences the cumulative weight of years of price increases stacked one on top of another every time they walk into a store. That distinction, familiar to economists as the difference between a rate and a level, turns out to be the single most important concept for understanding why national statistics and household experience have drifted so far apart.
Fast Facts
27 percent: Cumulative rise in grocery prices over the past five years, even as the year-over-year rate has slowed to roughly 2 percent
239 percent: Five-year price increase for a dozen eggs, the single starkest example of level versus rate
64 percent: Rise in auto insurance premiums between September 2020 and September 2025, more than double the general inflation rate over the same period
46.8 percent: Cumulative rise in home insurance rates nationally from 2020 to 2025, with some states nearly doubling
9 percent: An alternative cost-of-living measure including mortgage and interest payments, compared with 2.7 percent official CPI inflation at the same point, per Minneapolis Fed researchers
28 states: Where annual childcare costs already exceed the cost of public college tuition
The Difference Between a Rate and a Level
Consider groceries, the single most visible and most frequently repeated purchase in most household budgets. By the narrow measure that dominates news coverage, food prices are behaving almost reasonably: overall grocery prices rose roughly 2 to 2.7 percent in the twelve months ending in mid-2026, a rate close to normal historical inflation. But that calm annual figure obscures what actually happened to the price level itself. Grocery prices are up more than 27 percent from where they stood five years ago, according to Minneapolis Federal Reserve researchers, a cumulative burden that never resets simply because the year-over-year rate has slowed. Specific staples make the gap concrete and personal: a dozen eggs rose 239 percent over five years, ground chicken 46.3 percent, bread 42.5 percent, ground beef 34 percent, and milk 23.7 percent. Americans were spending an average of $169 a week on groceries as of early 2026, and as one recent analysis of the food price outlook put it plainly, a few extra dollars per trip does not register to a shopper as a data point. It registers as one less treat in the cart, one more store-brand swap, one more conversation about whether takeout is worth it.
This is the heart of the entire disconnect. Economists and central bankers are trained to think in rates of change, because rates tell them whether current policy is working. Households do not experience their finances as a rate of change. They experience them as an accumulated, ongoing weight, and no amount of the annual inflation rate slowing down actually lowers the price tag currently sitting on the shelf.
The Cost of Money Isn’t in the Basket
A second, less widely understood gap compounds the first. A team of economists, including former Treasury Secretary Larry Summers and researchers Marijn Bolhuis and Kyle Hood, constructed an alternative cost-of-living index that, unlike the official CPI, incorporates the interest households actually pay on mortgages, auto loans, and credit card balances. Their index tracked closely with official CPI for decades, until late 2023, when a significant gap opened between the two measures. As of their most recent comparison point, official CPI inflation stood at 2.7 percent, while their interest-inclusive cost-of-living measure stood at roughly 9 percent, more than three times higher. Their explanation for the gap cuts directly to the point this piece is making: “Consumers, unlike modern economists, consider the cost of money part of their cost of living,” they wrote. A family paying a mortgage at a rate two or three points higher than they would have secured five years ago is genuinely poorer in a way the official inflation rate, which largely excludes the cost of borrowing, simply does not register. That family is not misreading the economy when they say it feels harder than the headlines suggest. They are counting a real cost the headline number leaves out entirely.
Insurance: The Bill Nobody Budgeted For
If groceries produce the most visible sticker shock, insurance may be producing the most severe, and least discussed, actual damage to household budgets. Auto insurance premiums rose more than 64 percent between September 2020 and September 2025, according to Bureau of Labor Statistics data, more than double the 25 percent general inflation rate recorded over the identical period, a gap wide enough that auto insurance alone has become one of the single largest drivers of perceived cost-of-living pain independent of anything happening with wages or the broader economy. Home insurance has followed an even steeper and more geographically uneven path: national rates rose a cumulative 46.8 percent from 2020 to 2025, with Colorado’s cumulative increase exceeding 100 percent and Iowa’s and Minnesota’s each approaching a full doubling of rates over the same span, driven by a documented rise in severe convective storms, wildfires, and other climate-linked losses that insurers are now pricing directly into premiums. Pew Research Center found in May 2026 that 71 percent of American homeowners, the highest share on record, say they have personally noticed their premiums rising. Health insurance has moved in the same direction: employer-sponsored family coverage now averages roughly $27,000 a year, up 5.6 percent from the year before, while separate reporting on individual marketplace plans found premiums climbing sharply following the mid-2025 expiration of federal subsidies that had previously offset a meaningful share of the cost.
None of these categories show up in a way most Americans would recognize from the monthly inflation headlines, because insurance premiums are paid annually or semi-annually rather than at a weekly checkout counter, making the increases easy for national coverage to underweight and brutally easy for the household actually writing the check to notice.
“Consumers, unlike modern economists, consider the cost of money part of their cost of living.”
— Marijn Bolhuis, Larry Summers, and Kyle Hood, in a 2025 working paper on the gap between CPI and household experience
Childcare and Housing: The Two Categories CPI Was Never Built to Capture Well
This magazine has documented in depth how childcare and housing costs have compounded the same pressure from a different angle. Childcare costs rose 29 percent nationally between 2020 and 2024 alone, and in 28 states, the annual cost of center-based childcare now exceeds the price of public college tuition, a comparison that would have sounded absurd to a family budgeting a decade ago. Housing tells a similar story: a national shortage of roughly four million homes, concentrated at the entry-level price point young and growing families need most, has pushed both rents and home prices well beyond what wage growth has kept pace with, while a “lock-in effect” tied to elevated mortgage rates has left millions of existing homeowners unable to move even when moving would otherwise make financial sense. Both categories share the same structural problem as groceries and insurance: they are large, recurring, largely unavoidable expenses that consume a disproportionate share of a family’s budget, and that have moved further and faster than the headline inflation rate that is supposed to describe the economy these families are actually living inside.
Why the “Vibecession” Is Actually Rational
Put these threads together and the popular explanation for depressed consumer sentiment, that Americans are simply misreading a genuinely healthy economy, starts to look considerably less persuasive than the alternative: American households are accurately tracking a set of costs the headline statistics were never designed to fully capture. The categories driving the gap, food, insurance, housing, childcare, and the cost of borrowed money, share three features in common. They are recurring rather than one-time purchases, meaning their cumulative weight compounds year over year in a way a single annual inflation figure obscures. They are largely inelastic, meaning a family cannot simply stop buying groceries or cancel its home insurance the way it might delay a vacation or a new television. And they have, across the board, risen meaningfully faster than the headline inflation rate that is supposed to summarize the overall cost of living. A statistic that averages fast-rising necessities against slower-moving or even falling prices for discretionary goods like electronics will always produce a headline number calmer than what the household actually paying for groceries, insurance, and childcare experiences. That is not public confusion. That is public math, done correctly, on a different and arguably more relevant basket of goods than the one making headlines.
What Better Measurement, and Better Policy, Would Look Like
None of this means the official CPI is fraudulent or that policymakers are lying when they cite improving inflation figures; the rate of change genuinely has slowed, and that matters for where prices go from here. But this magazine believes government communication about the economy would earn far more public trust if it stopped leading with the headline annual rate alone and started reporting, alongside it, the kind of numbers that actually explain the disconnect: five-year cumulative price changes in the specific categories, groceries, insurance, housing, childcare, that dominate a typical family’s recurring budget, and a measure that accounts for the real cost of carrying debt at today’s interest rates rather than largely excluding it. On the policy side, the specific categories driving this gap point toward specific, addressable fixes this magazine has argued for elsewhere: genuine housing supply reform to relieve the shortage driving both rent and insurance costs, serious scrutiny of the climate and market dynamics driving home insurance premiums into near-unaffordable territory in entire states, and continued attention to the childcare cost crisis this magazine has covered in detail. Fixing the vibes requires fixing the actual math households are correctly doing every week at the checkout counter, not simply explaining to them why their own experience is wrong.
The Bottom Line
The next time a headline inflation figure is presented as reassuring evidence that the economy has turned a corner, it is worth remembering what that figure does and does not include. It does not include the five years of accumulated grocery price increases still sitting on every receipt. It does not fully include the cost of the mortgage or auto loan a family is actually paying today at today’s interest rates. It does not include the insurance premium that arrived in the mail 20 or 40 percent higher than last year’s. American households are not confused about the economy. They are simply doing a more complete accounting of it than the headline number ever attempted to, and until the statistics catch up to what families are actually carrying, the gap between Washington’s economic press releases and the kitchen table budget is unlikely to close on its own.
References
Federal Reserve Bank of Minneapolis, “More than a feeling? Making sense of elevated inflation expectations,” March 2025
The Queen Zone, “Food prices in 2026: What the outlook means for consumers,” July 2026
Yahoo News/Full Fact, “White House hails ‘Big Progress on Prices’ – US shoppers aren’t feeling it”
Fortune, “January 2025 CPI inflation report”
Yahoo Finance, “2026 insurance outlook: Costs will rise as technology evolves,” January 2026
LendingTree, “State of Home Insurance: 2026,” June 2026
Insurify/PR Newswire, “Insurify Projects Average Home Insurance Price Will Climb 4% in 2026, After Jumping 12% in 2025,” March 2026
ECIKS.org, “Insurance costs rising across auto, health, and home coverage in 2026,” May 2026
Inszone Insurance, “2026 Insurance Rate Forecast: 7 Trends Every Driver, Homeowner & Business Owner Should Watch,” April 2026
The World Data, “US Childcare Cost Statistics 2026,” April 2026